Access Testing: Who Benefits & How
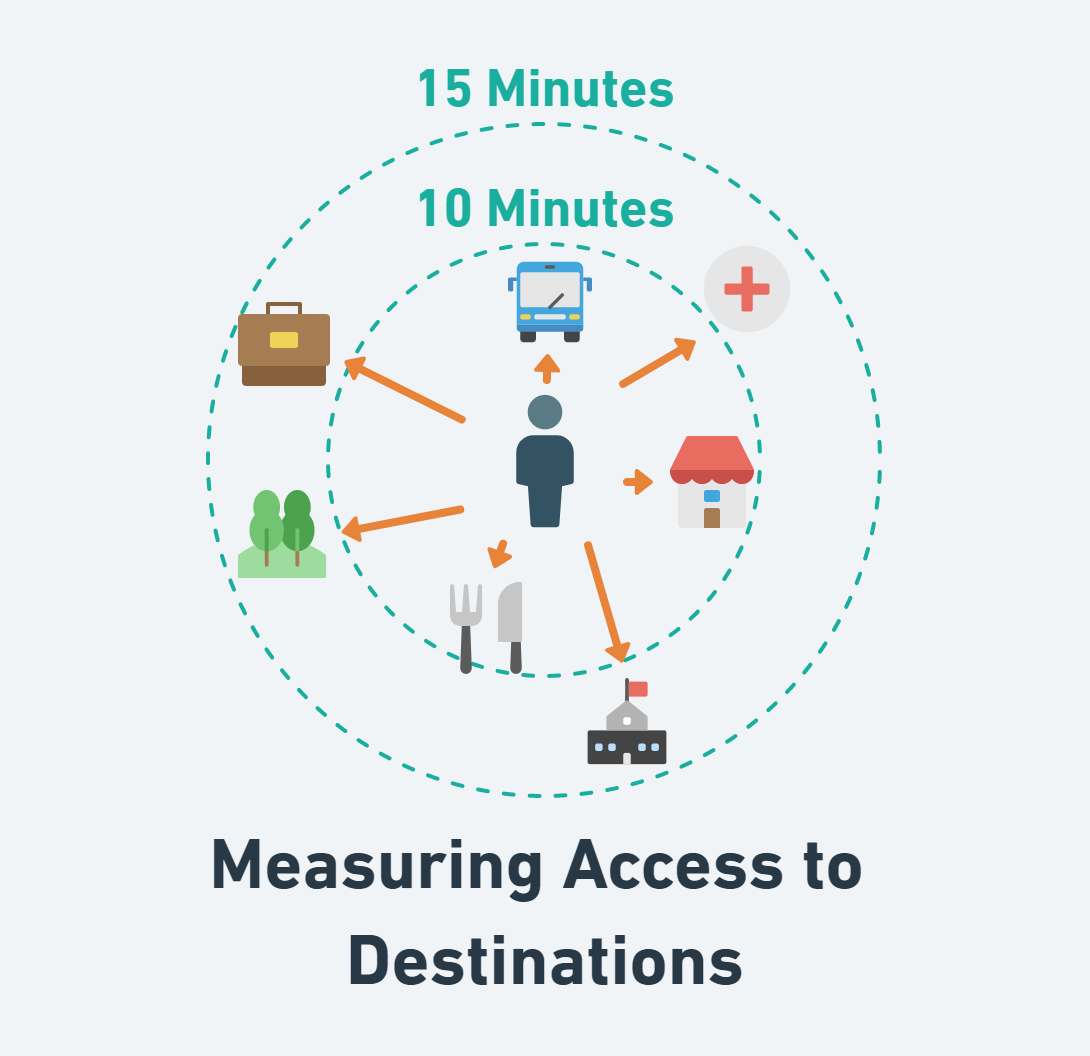
“Access” refers to the totality of opportunities reachable by a person given a specified time window (e.g., 15 minutes) and method of reaching it (e.g., walking, e-delivery)[i]. In the last few years, a variety of resources and guidebooks related to accessibility have been developed by academic committees, non-profit partnerships, international organizations, federal agencies, and other researchers. This post discusses a process of measuring access and a case study that uses automated methods to evaluate transportation projects and understand the magnitude and distribution of their benefits.
Access Perspective
Access is a powerful and robust metric for regional transportation planning for a few reasons:
Access can tell us, very specifically, who benefits—which groups have disparities in access to which opportunities, with which budgets, and which transportation options.
Access is more closely tied to the transportation system’s contribution to our quality of life more concretely than traditional facility metrics such as delay or pavement quality. Segment level evaluate say nothing about the people benefiting from or impacted changes in transportation infrastructure, access can.
Access is flexible. It can help us understand our options to reach different destinations, and adapt to various travel options and budgets.
Communities can take input directly from people about which destinations/opportunities they care about to drive decision-making.
Land use and transportation are connected. Access intrinsically considers how changing land uses impact destination access (proximity) alongside changes to travel networks (mobility).

It’s not a miracle metric, and progress finding clear integrations in practice is slow to build. There’s no universally-accepted standard for how many opportunities “should” be accessible within a given time horizon. It can be unclear how to evaluate tradeoffs between modes or edge effects from time cutoffs. Historically, we’ve thought about mobility and land use separately—and that can make it challenging to apply access in practice. Still, it’s a paradigm shift. Access thinks of mobility as a means to an end rather than an end to itself.
Access perspective expands the number of options communities have to increase access to opportunities, while also evaluating the transportation and land use of a community as coupled systems.
This perspective expands communities’ options to increase access to opportunities, while also conceptualizing transportation and land use as coupled systems. Fundamentally, access is about curating systems that connect people to opportunities.
Access Testing & Benefit Comparison

Operationalizing access as a tool to identify high-impact projects has been an area of interest of mine for awhile. Access-based tools can test the impact of different changes of transit service, understand the benefits of different bike highway alignments, or identify benefits of planned bicycle facilities and who they go to. This diagram outlines a prototypical process for evaluating gains in access benefits a target population (person access) might receive[ii].
This process could produce (for example):
A community geography identifying which neighborhoods benefit and how much (based on a cumulative access measure), or
Access gains for the general population and then stratified by equity priority populations.
Access change scores can then be rescaled to a common range (ex: percent rank) by opportunity type to create an Access Benefit Index for different groups. As part of a larger process, this can help identify projects projected to have a high access benefit based on changes in opportunities or network conditions.

Case Study: Low Stress Bicycling Access to Bellevue Downtown
There’s a lot of active work in Bellevue Downtown to make walking, cycling, and riding transit easier options. The BDA Downtown Access Strategy specifically calls out trying to reduce drive-alone trips downtown and encouraging a diversity of transportation options instead, including walking and rolling.
Many routes into and out of downtown, though, are on the arterial network, which is frequently stressful to use unless you’re in a car. Transportation planning practice has started to represent network quality for bicycle and pedestrian needs using traffic stress or comfort metrics. Similar to other US downtowns, Bellevue’s downtown network is crossed by many high-stress arterials. These act as soft barriers to travel that fragment low-stress connectivity akin to how transportation facilities can fragment ecosystems. Federal guidance has started incorporating this framework: the words “low-stress” networks appear prominently in FHWA’s Bicycle Selection Guide.

Thus, I was curious: if more high-quality bicycle facilities were added in downtown Bellevue, where could they go to have the largest impact on low-stress access?
I identified 15 potential routes that seem they would add low-stress connections to Bellevue’s Downtown, 4 of which cross the interstate. The routes selected here did not involve the City of Bellevue or Alta Planning + Design. This is armchair transportation planning at its worst. Real route selection would consider more criteria.
Incremental Access Gain
To figure out where our hypothetical bicycle facilities could go, I wanted to measure incremental access gain by project relative to some baseline condition. In this case, I had an OpenStreetMap-derived LTS network similar to the network used by PeopleForBikes’ Bicycle Network Analysis. To model improvements, I made some assumptions about the travel cost impedances of high-stress vs low-stress network segments, based on Conveyal’s simple assumptions that people will walk on high stress segments (3 MPH) and bike on low-stress segments (10 MPH).
In terms of tools, this analysis leveraged Pandana, a tool that can control the network while being incredibly scalable and fast[iii]. It can be a pretty powerful library for access analysis as recent noteworthy projects such as CityAccessMap have demonstrated.
Steps:
Measure baseline low-stress accessibility to destinations with some discounting for destinations further away[iv]:
Jobs (LEHD)
Parks (OpenStreetMap)
Dynamically adjust network impedances along project extents
Compute typical access after network augmentation
Compare access gains relative to the baseline analysis
Summarize results to Census Geography of the study area boundary
Compute weighted averages for access gain:
For jobs: total population - this means access gain to jobs is in terms of the average gain each resident of Bellevue would see.
For parks: youth population - this means access gain to parks is in terms of the average gain each youth resident of Bellevue would see. Instead of youth population, this could easily be some equity priority population, bike commuters, or some other set of demographics.
The results show incremental access gains for each node in the travel network for each hypothetical project. The numbers at the top of plot provide the summary of changes in average access to jobs that the typical Bellevue resident would see and average access to parks the typical youth resident would see because of the project[v].


For each facility tested, we can see a few things:
Even when discounting distant destinations, the benefits do not necessarily neatly accrue to areas around a facility. It depends on the orientation of destinations and connecting low-stress segments on the network.
Longer facilities or facilities that cross major barriers (freeways) tend to have a high impact on low-stress access.
Different facilities score highly for park access by youth residents and for job access by all residents, but they don’t always align in terms of which ones they identify as top performers. A weighted index would usually be created from these two scores.
Caveat: incremental access gain only tests improvements in isolation. When projects are tested together, they can have synergetic impacts on low-stress access as a low-stress network builds out. Testing all combinations can be difficult to achieve. Just testing 5 facilities without repetitions out of the 15 would have 3000+ combinations.
Catalytic Seeds & Cumulative Access
One option is to assume the facilities with the highest incremental access gain are “catalytic seeds” to “grow” a backbone network from. Here’s the algorithm I used:
Determine facility with the highest access gain.
Identify all touching planned facilities and select the connected planned facility with the next highest access gain.
Test the facilities together to identify their access gain contribution.
Repeat steps 2 with the new subset network, and then step 3 to test their cumulative contributions to access.
This is a pretty simple approach to identify high priority network segments. Not perfect, but good enough. For this network, applying this process for jobs and park access looks like this:


This is a very narrow way to select high-priority network facilities. In practice, we might generate scores or points for incremental access scores to inform a connectivity score as part of a wider prioritization. In theory, seed facilities could be identified on that final index. This does show, though, that our access priorities (job access for all or park access for youth) could influence which facilities make sense to choose and the order to consider them in.
An actual application of this approach might be to test the benefits of a high-priority network and identify how many facilities would need to be built to have a high impact. Taking ideas from how High Injury Networks (HINs) are identified in Vision Zero Plans, maybe you could identify a High Access Network (HAN), that achieve a disproportionate amount of access gain relative to a full build out. For example, the first 5 facilities from the cumulative job access charts achieve ~60% of the access benefits of all 15 based on this approach.
Future Work
Internal Tools – Alta Planning & Design is looking to develop internal web applications that enable dynamic testing of facilities and access via OSMnx or Pandana. I developed a prototype flask application previously to illustrate the concept.

Resilience Applications
Access loss can be used to evaluate facility importance or the impacts of hazards such as Sea Level Rise using the same approach. This type of analysis could be folded into a criticality analysis that combines volume data (Replica, StreetLight, Counts), dependent systems analysis, and other metrics to identify the intersection of risk and critical infrastructure function. If we use access for this, a criticality analysis could show us the distribution of access loss to community-identified priority destinations.
For example, this sample analysis identifies that many areas outside inundated locations (in orange) in south Florida would experience substantial losses in accessibility to jobs. The results are not surprising, but illustrate the potential applications of understanding mobility and quality of life consequences of such emerging risks and hazards.
Endnotes
[i] Accessibility is an overloaded term within transportation (Litman, 2022). In pedestrian planning it can reference accessible design, where the focus is on how we meet the needs of people with disabilities or special needs. In transportation engineering, it can reference access management, where the focus is on tradeoffs between providing for mobility and land access (frequency of driveways, etc.) that of accompany discussions of roadway functional class. The confusion is why some guides on measuring the concept of transport accessibility have often referred to the concept as connectivity (FHWA, 2018).
[ii] Generally, there are two major types of accessibility when it comes to transportation policy analysis, person vs. place accessibility (Martens, 2017). Person accessibility can be thought of as trying to identify how many opportunities someone has access to, whereas place accessibility would measure an opportunity’s access to people. You can imagine these things mean different things to different people. If you are buying a house, you might care more about how many grocery stores or restaurants you can access. But if you are building the grocery store, you care more about how many people are in your market and size the building accordingly. Place accessibility can be calculated as a naïve average gain in people each place (destination) would receive, and benefit differentials would be determined by comparing different populations change in access to destinations. They both can be used to inform policy decision making, but they are all about the perspective of who is being scrutinized by an analysis.
[iii] There is now a larger set of tools available to assist with this type of analysis ranging from ArcGIS Network Analyst, QNEAT, R5, NetworkX, Pandana, OpenTripPlanner, and many other routing engines. When it comes to testing different access scenarios, there are a few things I try to find in the tool:
· Enables projects whether augmenting existing network performance or adding new links (control of the network)
· Fast and scalable for city to regional level accessibility analysis
· Flexible enough to accommodate multiple destinations identified by public feedback
· Show changes in access across a community at a small unit of analysis
[iv] Impedance adjustments often use “distance decay” to represent the idea that things being further away are less likely to be used. The Transport Access Manual has some discussion on this (pg. 48).
[v] The choice of youth park access was just to illustrate demographic stratification. The process for this is summarizing access gain statistics to census block group boundaries, and then taking the relevant demographic data and us it as a weight for a weighted average. In this case, the weights would be the population totals for youth residents within the City of Bellevue.
Citations & Further Reading
The Committee of the Transport Access Manual. (2020). Transport Access Manual: A Guide for Measuring Connection between People and Places. https://hdl.handle.net/2123/23733
Federal Highway Administration. (2018). Guidebook for measuring multimodal network connectivity. https://www.fhwa.dot.gov/environment/bicycle_pedestrian/publications/multimodal_connectivity/
Sundquist, K., & Others. (2021). Measuring Accessibility. State Smart Transportation Initiative. https://ssti.us/wp-content/uploads/sites/1303/2020/12/Measuring-Accessibility-Final.pdf
International Transport Forum. (2017). Linking People & Places. https://www.itf-oecd.org/linking-people-and-places
Litman, T. (2022, October). Evaluating Accessibility for Transport Planning Measuring People’s Ability to Reach Desired Services and Activities. Victoria Transport Policy Institute. https://www.vtpi.org/access.pdf
Mekuria, M., Furth, P., & Nixon, H. (2012). Low-Stress Bicycling and Network Connectivity. Mineta Transportation Institute. https://transweb.sjsu.edu/research/Low-Stress-Bicycling-and-Network-Connectivity
Martens, K. (2017). Transport justice designing fair transportation systems. Routledge, Taylor & Francis Group.
Proffitt, D. G., Bartholomew, K., Ewing, R., & Miller, H. J. (2019). Accessibility planning in American metropolitan areas: Are we there yet? Urban Studies, 56(1), 167–192. https://doi.org/10.1177/0042098017710122
Hochmair, H. H., Zielstra, D., & Neis, P. (2014). Assessing the Completeness of Bicycle Bike Path and Lane Features in OpenStreetMap for the United States. Transactions in GIS, 19(1), 63–81. https://doi.org/10.1111/tgis.12081
PeopleForBikes. (n.d.). Bicycle Network Analysis. PeopleForBikes. https://peopleforbikes.org/placesforbikes/bicycle-network-analysis/
Conveyal. (n.d.). Better measures of Bike Accessibility. Conveyal. https://blog.conveyal.com/better-measures-of-bike-accessibility-d875ae5ed831
Wasserman, D., Rixey, A., Zhou, X. (Elynor), Levitt, D., & Benjamin, M. (2019). Evaluating OpenStreetMap’s Performance Potential for Level of Traffic Stress Analysis. Transportation Research Record, 2673(4), 284-294. doi:10.1177/0361198119836772
Harvey, C., Fang, K., & Rodriguez, D. A. (2019). Evaluating Alternative Measures of Bicycling Level of Traffic Stress Using Crowdsourced Route Satisfaction Data. Mineta Transportation Institute. https://scholarworks.sjsu.edu/mti_publications/276/
Accessibility Observatory. (2017). Access Across America. University of Minnesota.
Boeing, G. (2022, November 16). Around the world, cities are falling short on health and sustainability goals. Brookings. https://www.brookings.edu/blog/the-avenue/2022/11/16/around-the-world-cities-are-falling-short-on-health-and-sustainability-goals/
Nicoletti, L., Verma, T., & Sirenko, M. (2022). Disadvantaged Communities Have Lower Access to Urban Infrastructure. Environment and Planning B: Urban Analytics and City Science.
Mocnik, F.-B., Mobasheri, A., & Zipf, A. (2018). Open-Source Data Mining Infrastructure for Exploring and Analysing OpenStreetMap. Open Geospatial Data, Software and Standards, 3(1), 7. https://doi.org/10.1186/s40965-018-0047-6.
Alta. (2017, November 29). Level of traffic stress - what it means for building better bike networks. Medium. https://blog.altaplanning.com/level-of-traffic-stress-what-it-means-for-building-better-bike-networks-c4af9800b4ee